Hazelle
in Memos & Musings · 4 min read
Since late July this year, the S&P 500 began its pullback where we saw a dip of approximately 8%.
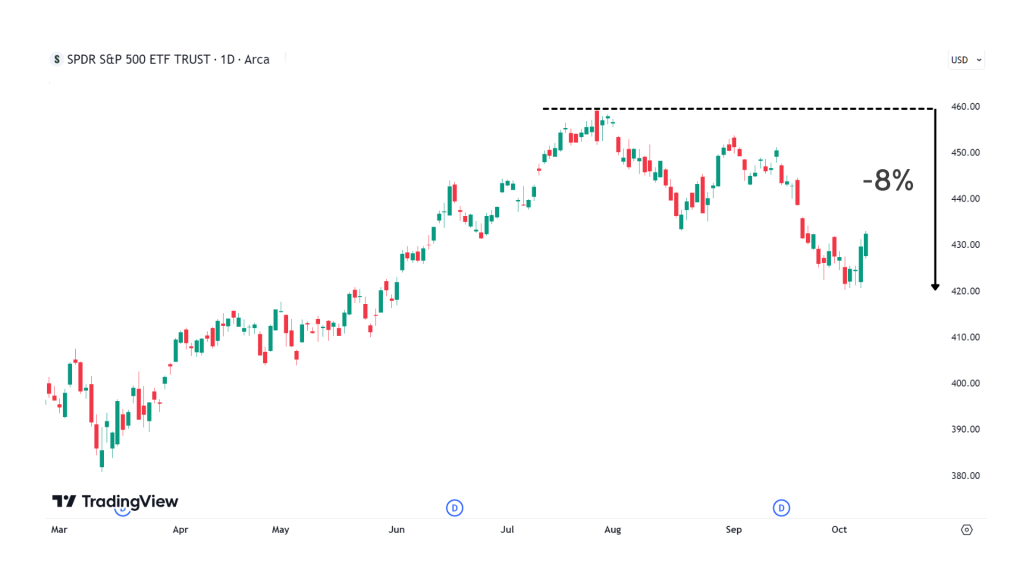

SPY ETF that tracks the S&P 500
During our latest Zoom sharing last month, we also did a poll with the attendees on their sentiments of the recent pullback. From the poll results, it seems that more investors are beginning to get a little uncertain and worried about the pullback.
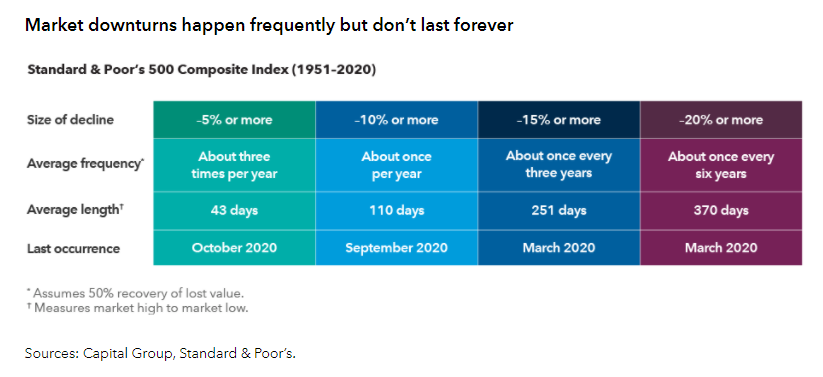
Firstly, let’s put things into perspective. A market pullback of 5% or more has happened on average, about 3 times a year based on historical statistics. Such market dips occur rather frequently.

Where are we now in the markets?
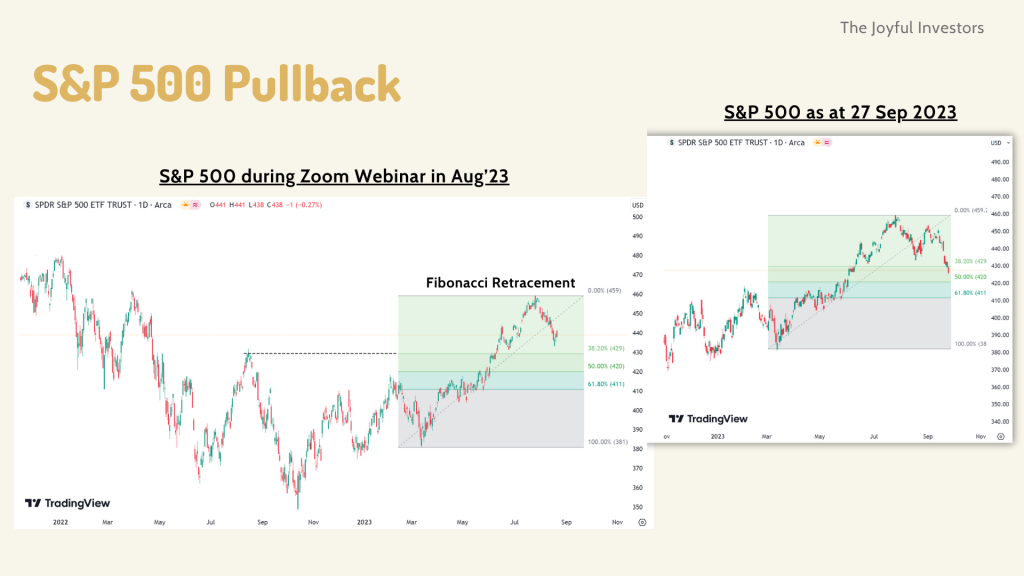

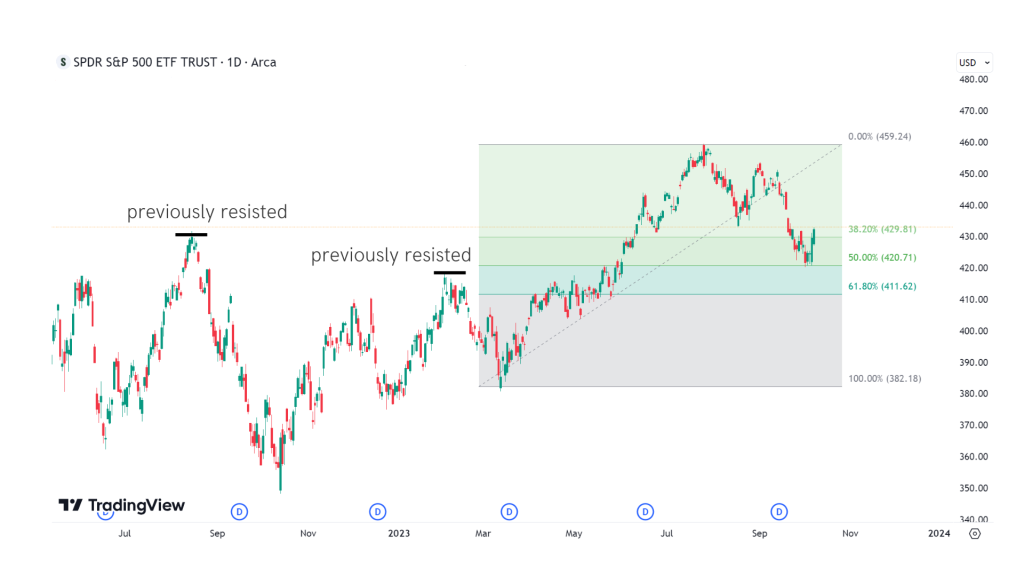
A screenshot of one of the slides shared during the latest Zoom webinar
You may be wondering, where did these levels come from?
These price levels are obtained by applying the Fibonacci Retracement indicator on the most recent rally for the S&P 500. Fibonacci Retracement tool is used to identify potential levels of support and resistance on a stock price chart.
The 38.2% and 50% Fibonacci levels are potential levels where stock price may find support at during a retracement. These 2 Fibonacci Retracement levels were formed at the $430 and $420 price region respectively. In the event if these levels are broken, the next level of support we would be looking at would be the 61.8% Fibonacci level.
In addition, these 2 levels also coincided with levels where prices were previously being resisted for the SPY ETF.
The most recent price movement in early Oct showed a rebound after testing the $420 support region.

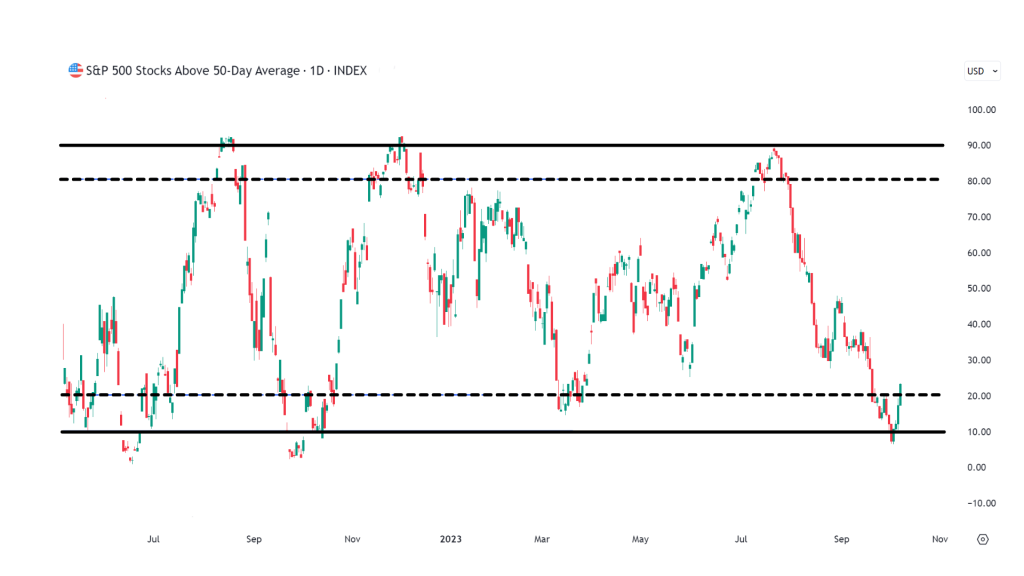
Market breadth was recently at the lows
In fact, the market breadth also gave us some indication of the recent October rebound.
Market breadth tells us the underlying strength of the market index. When the percentage of S&P 500 stocks which are above 50-day average reaches between 10% – 20%, it usually signals that the S&P 500 may go through a rebound in the near term.
Since late September, the percentage of S&P 500 stocks which are above 50-day average reaches reached the 10% – 20% region, which signals a possible imminent rebound.

What about the potential impact of the Israel war?
Initially when news of the violence in Israel broke out earlier this week, the U.S futures tumbled. If the ongoing conflict between Israel and Hamas were to escalate or to expand into a regional war where more parties become involved, it may potentially cause disruptions in the supply of oil and gas, and lead to higher prices for these resources.
The broader implication is that it may contribute to further inflation and thus affect the rate hikes and the stock market. Such geopolitical crises may be nerve wrecking for investors.
However, similar to what happened when Russia invaded Ukraine in February 2022, we shared that the best market response would be if the world largely ignored it. Geopolitical tensions usually are non-events and have had limited effects on the stock market, something that traders and investors should bear in mind today as well. Following the invasion, stock prices declined briefly, and it appears to be the same now.
It is likely that this conflict would, like the Ukrainian war, remain confined to the region and is unlikely to have a significant impact on the U.S. or global economies. It seems that the focus is still pretty much on the FED and how the interest rates would be for now.
Create win-win outcomes for your portfolio
While we can’t predict for certain the magnitude of this recent rebound in early October — whether it will be a short-lived one or a strong rebound, or whether the Israel war may bring about more far-extending impacts, what we can do is to move with the markets.
What do we mean by that?
If the stock market continues to rally, our existing portfolio will grow in value. We may also consider taking profits for some stock positions that are overextended to recycle our limited capital into other stock opportunities with better risk-to-reward.
On the other hand, if the stock market goes through a deeper pullback, that could be an opportunity to buy more shares of the quality companies that are fundamentally sound. This allows us to accumulate more positions of good stocks so that we can ride up the wave when the stock price eventually recovers.
Therefore regardless of how the stock market moves, we create win-win outcomes for our investment portfolio. We move with the markets and act accordingly to the price fluctuations.


About Hazelle
Chief trainer of The Moneyball Investors Playbook program and founder of The Joyful Investors, a financial education firm that seeks to help avid investors learn to invest better and make the journey a joyful one. I graduated with a first class honors in Bachelor of Accountancy from Nanyang Technological University (NTU) and started my auditing career in one of the Big Four. I believe that once we know how to build our wealth sustainably, we can then live our best lives ever.
Important Information
This document is for information only and does not constitute an offer or solicitation nor be construed as a recommendation to buy or sell any of the investments mentioned. Neither The Joyful Investors Pte. Ltd. (“The Joyful Investors”) nor any of its officers or employees accepts any liability whatsoever for any loss arising from any use of this publication or its contents. The views expressed are solely the opinions of the author as of the date of this document and are subject to change based on market and other conditions.
The information provided regarding any individual securities is not intended to be used to form any basis upon which an investment decision is to be made. The information contained in this document, including any data, projections and underlying assumptions are based upon certain assumptions and analysis of information available as at the date of this document and reflects prevailing conditions, all of which are accordingly subject to change at any time without notice and The Joyful Investors is under no obligation to notify you of any of these changes.
· · ·
Have you enjoyed this article? We’d be grateful if you would share this useful content to your friends who may benefit from it as well.

