Dear INP Fam,
Here is a quick guide on how to interpret the performance metrics shown on the InvestingNote portfolio dashboard. In this post, we will walk you through how the returns are calculated on the InvestingNote platform — and more importantly, which metric may better reflect the real performance of any portfolio — including yours.
Understanding the 4 Return Metrics displayed on InvestingNote Platform
Before we dive into which metric gives a more accurate portray of our portfolio profitability, let’s first define the four main return metrics displayed on the platform:
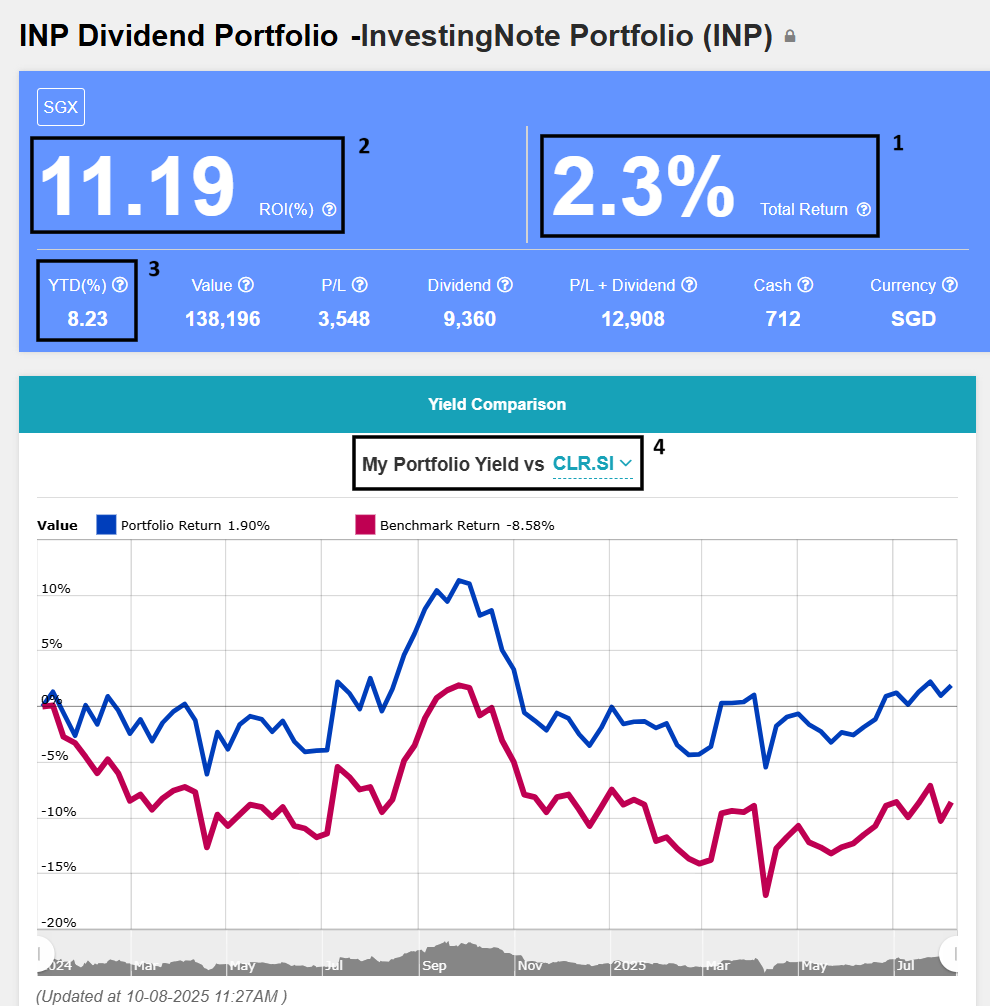
Screenshot of the Portfolio Dashboard on InvestingNote Platform
1) Total Return
Computed as:
(Realized Profit/Loss + Unrealized Profit/Loss) ÷ Total Cost of All Transactions
This measures how much gain or loss you’ve made relative to the total money you’ve spent on all trades. It includes both open (unrealized) and closed (realized) positions.
Example: In Year 1, we start with $10,000 capital and invest it all in Stock A.
- We make a $500 profit and sell it.
- Then, we reinvest the same $10,000 into Stock B.
- Stock B now has an unrealized gain of $50.
The platform calculates the “Total Return” as:
($500 realized + $50 unrealized) ÷ $20,000 total transaction cost = 2.75%
But in reality, we only used the same $10,000 capital, and made a total gain of $550 —
$550 ÷ $10,000 = 5.5%
This consequently understates the true return for the year, and causes the dashboard to register a lower total return on the system.
2) ROI
On the other hand, ROI gives a more accurate reflection of how the portfolio is performing.
ROI is a time-weighted return (TWR) that reflects the compounded growth of the portfolio, excluding the impact of cash deposits and cash withdrawals during the year.
As investors, we may top up different amounts at different times. Each top-up is effectively invested for a different duration. TWR accounts for this by isolating the effect of investment performance, not the timing or size of cash flows. This removes the distortion caused by deposits or withdrawals.
For example, if you deposited more funds halfway through the year, ROI doesn’t give you “extra credit” just because your portfolio got larger — it purely reflects how well your investments have performed overall.
This makes ROI a fair and consistent way to measure performance, especially when comparing against benchmarks or other portfolios.
3) YTD
On the platform, YTD is calculated based on:
Portfolio value at the beginning of the year vs. current portfolio value
It does not eliminate the effect of cash deposits or withdrawals made during the year.
4) Yield Comparison Chart
Finally, the Yield Comparison Chart uses the “1) Total Return” metric to plot against a benchmark such as STI, Dow Jones, S&P 500 etc.
The chosen benchmark should be appropriately comparable, which may not always be the case by default on the dashboard. For instance, if a portfolio is heavily weighted towards REITs, suitable benchmarks would include CLR (Lion-Phillip S-REIT ETF) or SRT (CSOP iEdge S-REIT Leaders Index ETF), both of which track a basket of Singapore REITs.
Conversely, using ES3 (Straits Times Index ETF) as a benchmark would be inappropriate in this context. As of May 2025, ES3 comprises less than 40% REITs, with Singapore banks making up approximately 50% of the index—making it an unsuitable comparison for a REIT-focused portfolio.
Which Metric Should We Use to Measure Performance?
Based on the above understanding, ROI is the most accurate and reliable measure of return — especially when comparing performance across different portfolios or against benchmarks.
- It reflects true investment performance
- It removes the distortion of capital top-ups or withdrawals
- It gives a fair, time-weighted measure of compounded growth
As such, we strongly recommend that when running through any portfolio built on the InvestingNote platform, we may better refer to ROI as the main performance indicator, and the other metrics such as “Total Return”, “YTD” or the “Yield Comparison Chart” metrics may not paint the most accurate picture given the circumstances.
Tracking ROI Year by Year
Do note that the ROI shown on the platform is cumulative since the inception of the portfolio. It does not reset annually.
To assess the performance of the portfolio for a specific calendar year (e.g., YTD performance), we manually calculate the ROI based on year-end data.
Here’s how we do it:
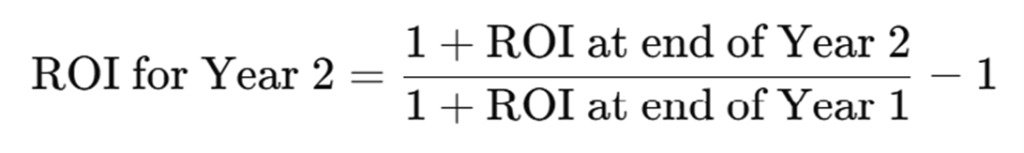
Example:
- ROI at end of Year 1 = 10%
- ROI at end of Year 2 = 25%
ROI for Year 2 = (1 + 0.25) ÷ (1 + 0.10) – 1 = 1.25 ÷ 1.10 – 1 = 13.64%
This method ensures that our Yearly ROI remains based on time-weighted return, and gives a clean, accurate picture of how the portfolio performed in that specific year — not distorted by capital movements.
We hope this walkthrough provides a clearer understanding of how returns are calculated on the InvestingNote platform — and why ROI in the dashboard may better reflect the portfolio’s performance over time.
Just a quick note — the InvestingNote Portfolio subscription is built on the platform that is maintained by the InvestingNote’s developers. While we are active users of the platform just like you, we’ll continue to communicate with the InvestingNote team to share feedback and explore how the platform features can be improved over time for all users.
If you have any questions, feel free to leave a comment and let us know!
Read also: Differences Between InvestingNote Portfolio and Moneyball Investors Portfolio
To your investing success,
The Joyful Investors
· · ·
Have you enjoyed this article? We’d be grateful if you would share this useful content to your friends who may benefit from it as well.