Last Updated: November 5, 2024
How do we screen for dividend stocks to invest in? What are some criteria to analyse before we buy? Read on to learn more!
1. Dividend yield
Dividend yield is obtained by taking the annual dividends per share divided by the price per share. It tells us how much dividends we are receiving relative to the share price of the stock.
In general, investors would like to invest in a stock that has a higher dividend yield. But that’s an analysis at the very base level. That’s because a high dividend yield may sometimes occur due to falling share prices, thus creating a dividend yield trap.
Let’s revisit the formula for dividend yield again.
Dividend yield = Annual dividends per share / Share price
When we say we want a higher dividend yield, we are logically thinking of getting a corresponding increase in annual dividends per share so that the resultant dividend yield is higher.
Yes, if the high dividend yield is due to a high dividend per share, then that would be favourable for investors.
But, not to forget that the share price of a stock is also a variable in this formula! So in a situation when share prices decline, the dividend yield can still increase even if the dividend per share stays constant or gets smaller.
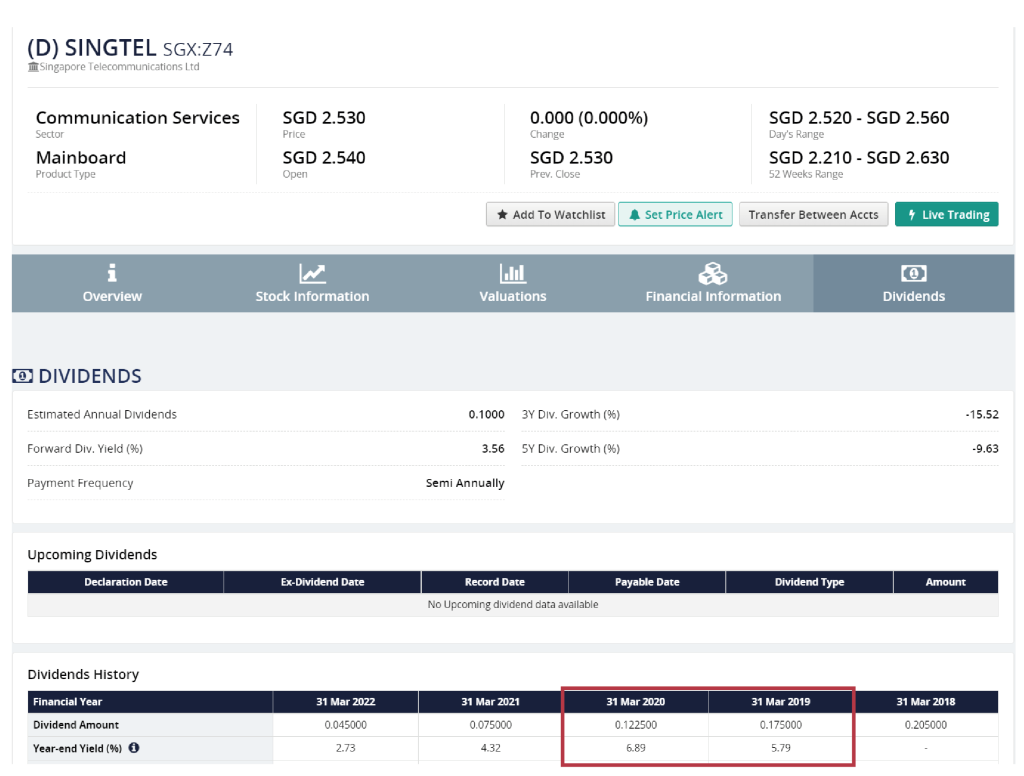
To illustrate, take a look at Singtel. A seemingly high dividend yield of over 6% in 2020 does not necessarily mean that this is a good investment. In fact, the dividend yield for 2020 had been higher than 2019 but notice that the dividends per share in 2020 was lower than in 2019 as the higher dividend yield was due to the falling share price.

Source: Fundsupermart
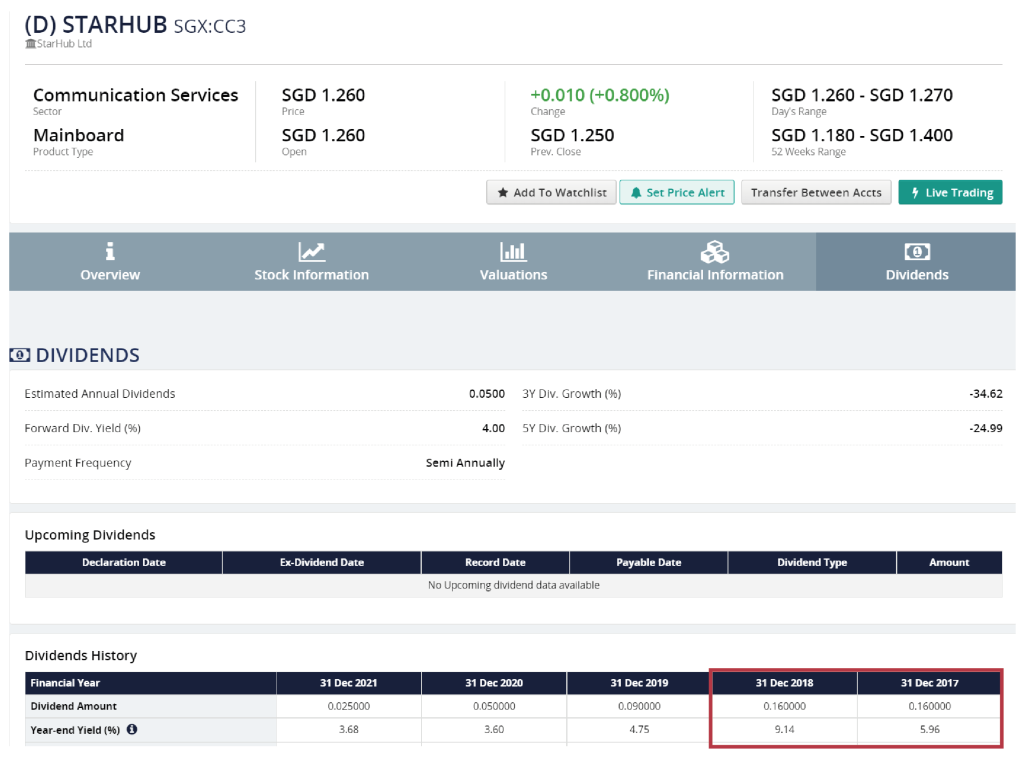
Another example, Starhub saw an unusually high dividend yield in 2018 as well although the dividend per share in 2018 was the same as in 2017.

Source: Fundsupermart
Now you may ask, is a decline in share price something to worry about? Yes and no.
Yes if the decline in share price is due to worsening of the fundamentals of the company. In this case, you may not even want to be holding the shares of the company anymore.
Nonetheless, there are many occasions in the stock markets when stocks are mispriced due to irrationality and manipulation and not due to a change in the fundamentals of the company. In those situations, then the falling share prices would not constitute a dividend yield trap if there is no change to the fundamentals and the dividend payouts are still fairly consistent.
Therefore, while investors would generally like to see high dividend yield and use it as a metric to screen for dividend stocks to invest in, we have to be careful and make sure to analyse further to understand if the dividend yield has been distorted due to share price fluctuations.
2. Total returns
Well, but not to worry, the next one can help you to be less susceptible to dividend yield trap and investing in companies which may already have underlying issues in the fundamentals. That is, to look at the total returns that you could have gotten if you had invested in the stocks at least 5 years ago.
As we have shared in our previous video on “Getting Started On Dividends Investing”, though generally investors invest in dividend yielding stocks for the dividends, it does not necessarily mean that there will be no or little capital appreciation to enjoy. In fact, if the stock prices are declining over the years resulting in capital losses for investors, that could signal a red flag that there lies an even bigger problem with the business of the company!
Therefore, always check out the stock chart to see the performance of the stock over the years to ensure you don’t end up investing in a company which is on a long term downtrend. Else, the dividends you collected are not likely to be sufficient to cover your capital losses!
If you would like to put some numbers in to get a clearer perspective of things, here is how you can compute. First, find out what is the capital gain or stock price increase over a period of at least 5 years and then add on the dividends paid by the company over the same period of time. Next, divide the total returns by the stock price of the company at that time to get a rough gauge of the percentage returns you would have gotten if you had invested in this stock then.
Additionally, do take note that there are some REITs which have more cyclical price movements, for example, Ascott Trust (HMN) and CapitaLand Integrated Commercial Trust (C38U). For such REITs, your purchase price would greatly influence the net profitability of your investment in those dividend stocks. Many dividend investors realise that over the years, the dividends collected are not even sufficient to offset the capital losses they made. Hence, knowing when to buy the dividend stocks also matter as well.
3. Dividends to free cash flow
Here is how it works. If we have a dividends to free cash flow ratio of 30%, it implies that for every $1 of free cash flow the company generates, it only pays out 30 cents as dividends.
Why we need to look at this metric is because other than finding stocks that give high dividends, we also want the companies to have the ability to distribute stable and consistent dividends, in other words, the sustainability of the dividends distribution over the long term.
The rationale behind this metric is quite similar to that of another ratio called the dividend payout ratio, except we are now working with cash flow instead of net income to give us a better idea of the sustainability of the dividends distribution.
Net income is an accounting figure so there are some items that are non-cash but they are part of deriving the net income figure for a company. To explain in slightly more layman’s terms, it means that certain transactions of recording revenue or of recording expenses do not involve the inflow or outflow of cash.
In addition, the net income figure is generally more easily subjected to accounting manipulations due to the involvement of judgment and estimates. As a result, a company could have earned for example, $1 million net income but it only has generated $700k increase of cash for the year. Hence, using free cash flow give investors a better idea on whether the company has sufficient cash to pay out its dividends on time and whether the dividends distributed are sustainable.
An overly high dividends to free cash flow ratio may be unsustainable over the long run as the company would still need to use cash for its business purposes. If a company has a dividend to free cash flow ratio of more than 1, that is not ideal as it implies that the company is paying out more cash as dividends than how much it is growing. Never go for stocks that give you high dividends in just only one or two years at the expense of the sustainability of the dividend distribution over the long run.
Next up, stay tuned for our upcoming blog post as we will be sharing some of the untold truths of dividend investing!
You may follow us on our Telegram channel for more investing insights.


Pingback: How To Set Yourself Up To Get Dividends From Singapore Stocks? - The Joyful Investors
Hi, thanks for sharing. In relation to Dividends to Free Cash Flow, what would be a healthy ratio to ascertain if the company has the ability to distribute stable and consistent dividends?
Hey Yong, a general rule of thumb is that the ratio should be less than 1 which means that the FCF generated for the year can cover the dividends to be paid